Atmospheric dynamics
NH state of the climate
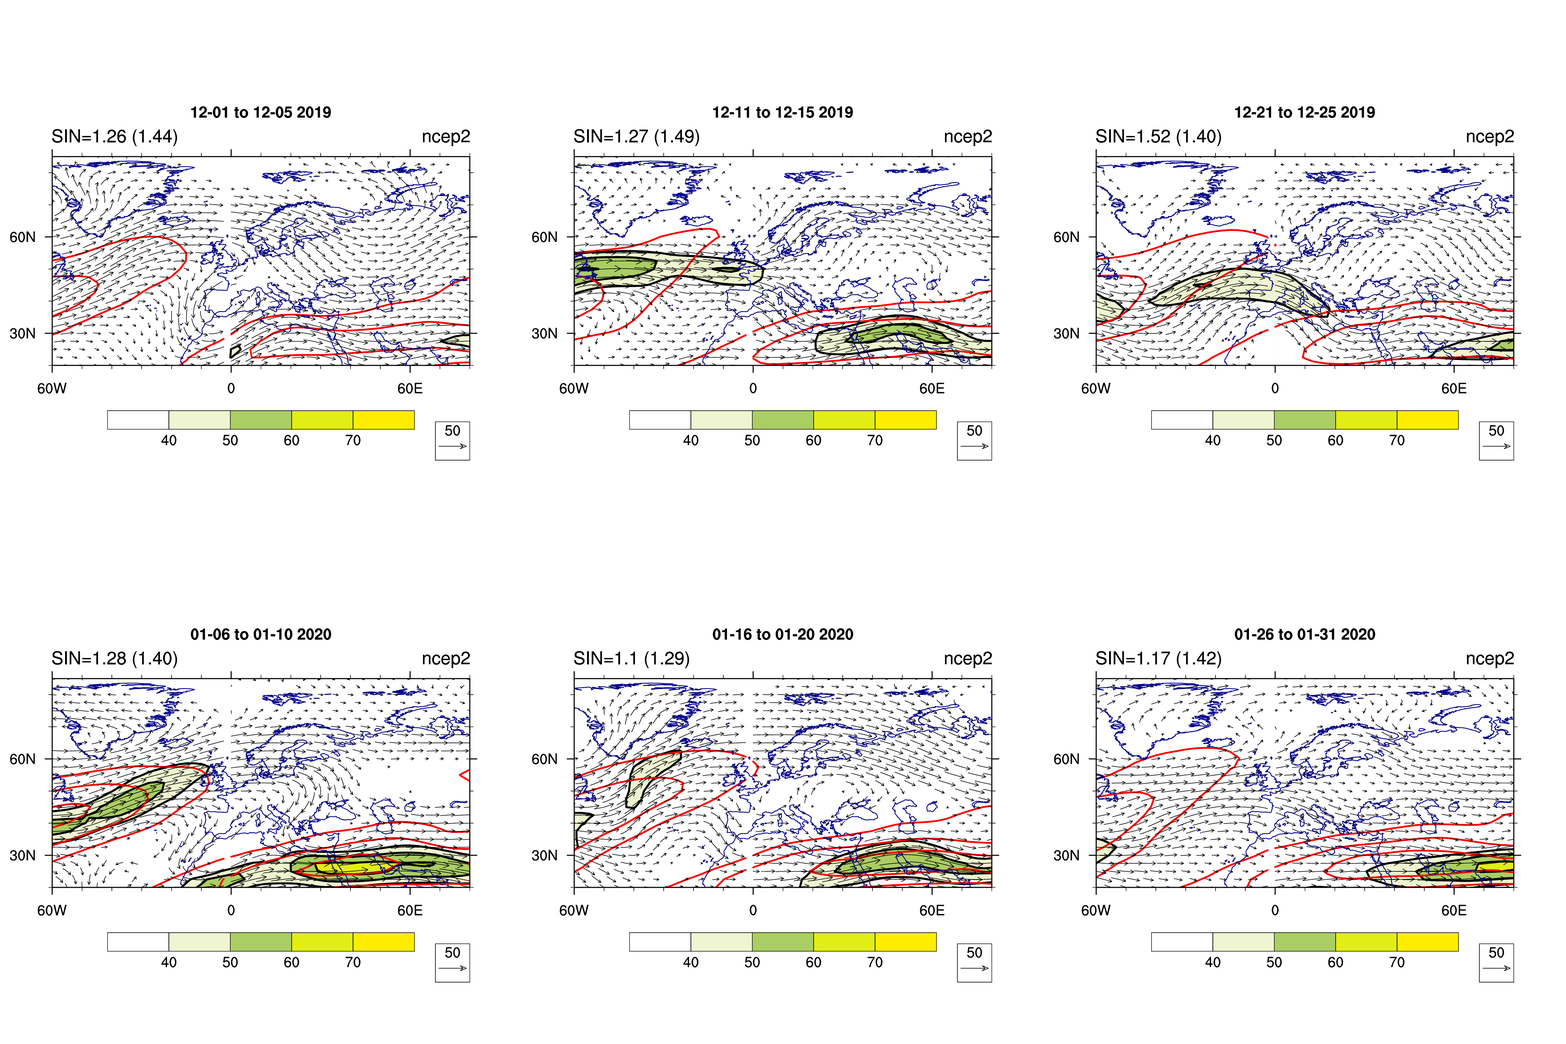

Wind speed (shading, m/s) and direction (vectors) at 300 hPa
Atlantic
Jet stream at 300 hPA
Pacific
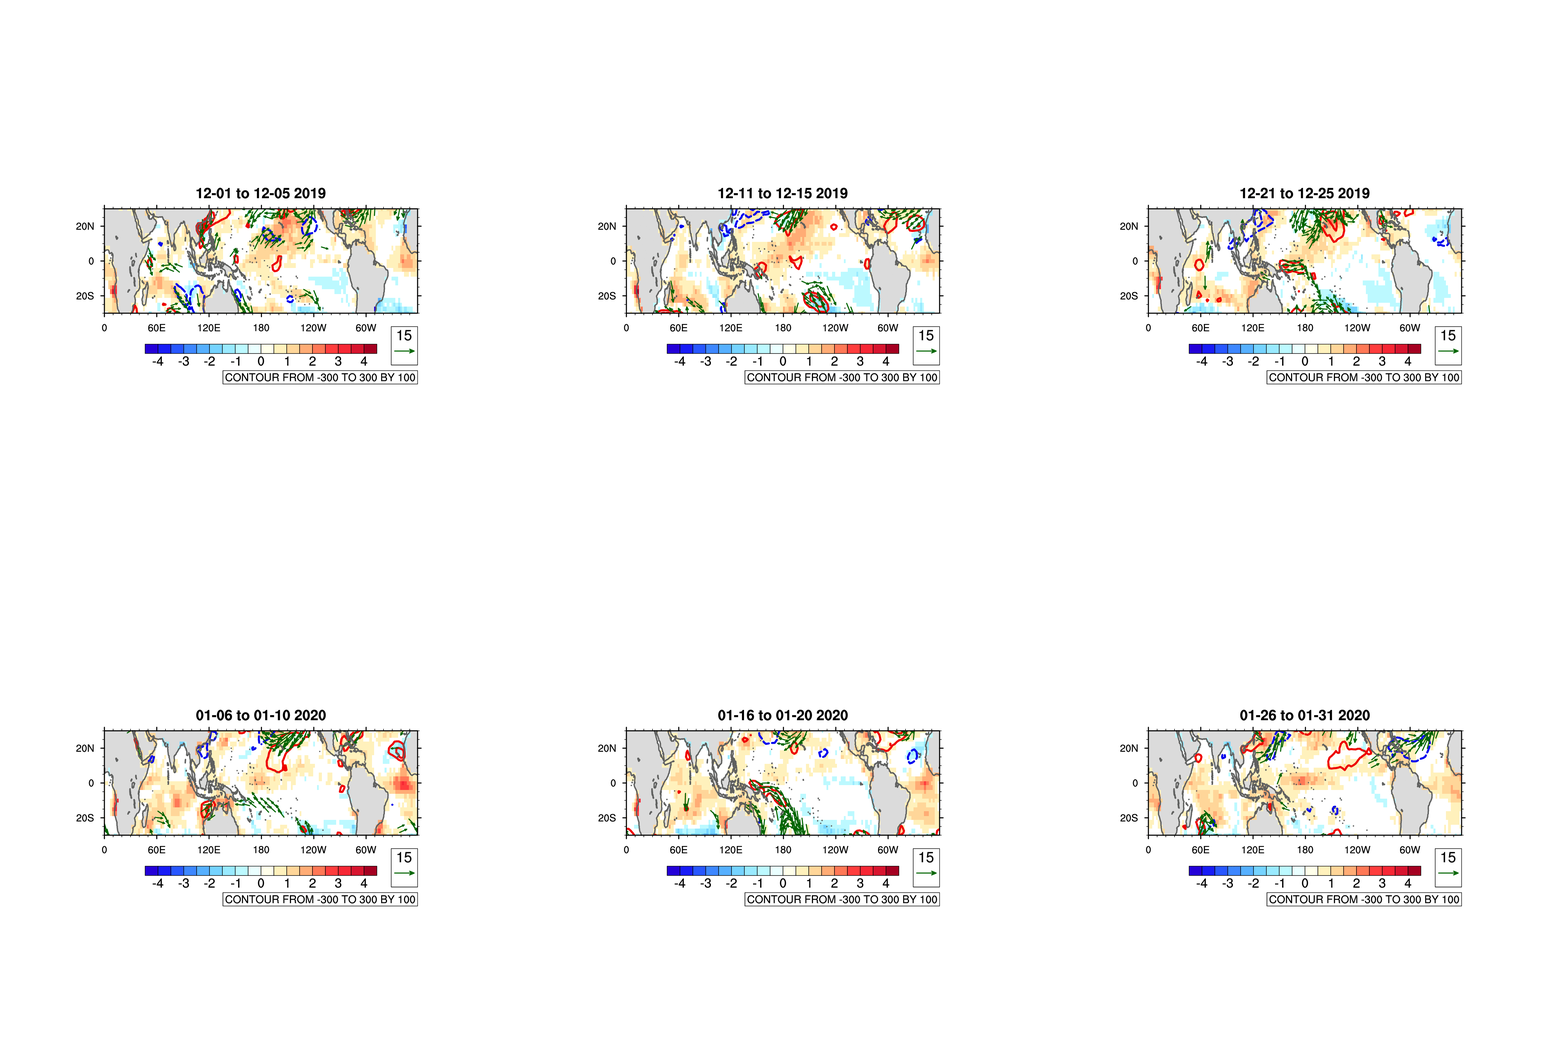
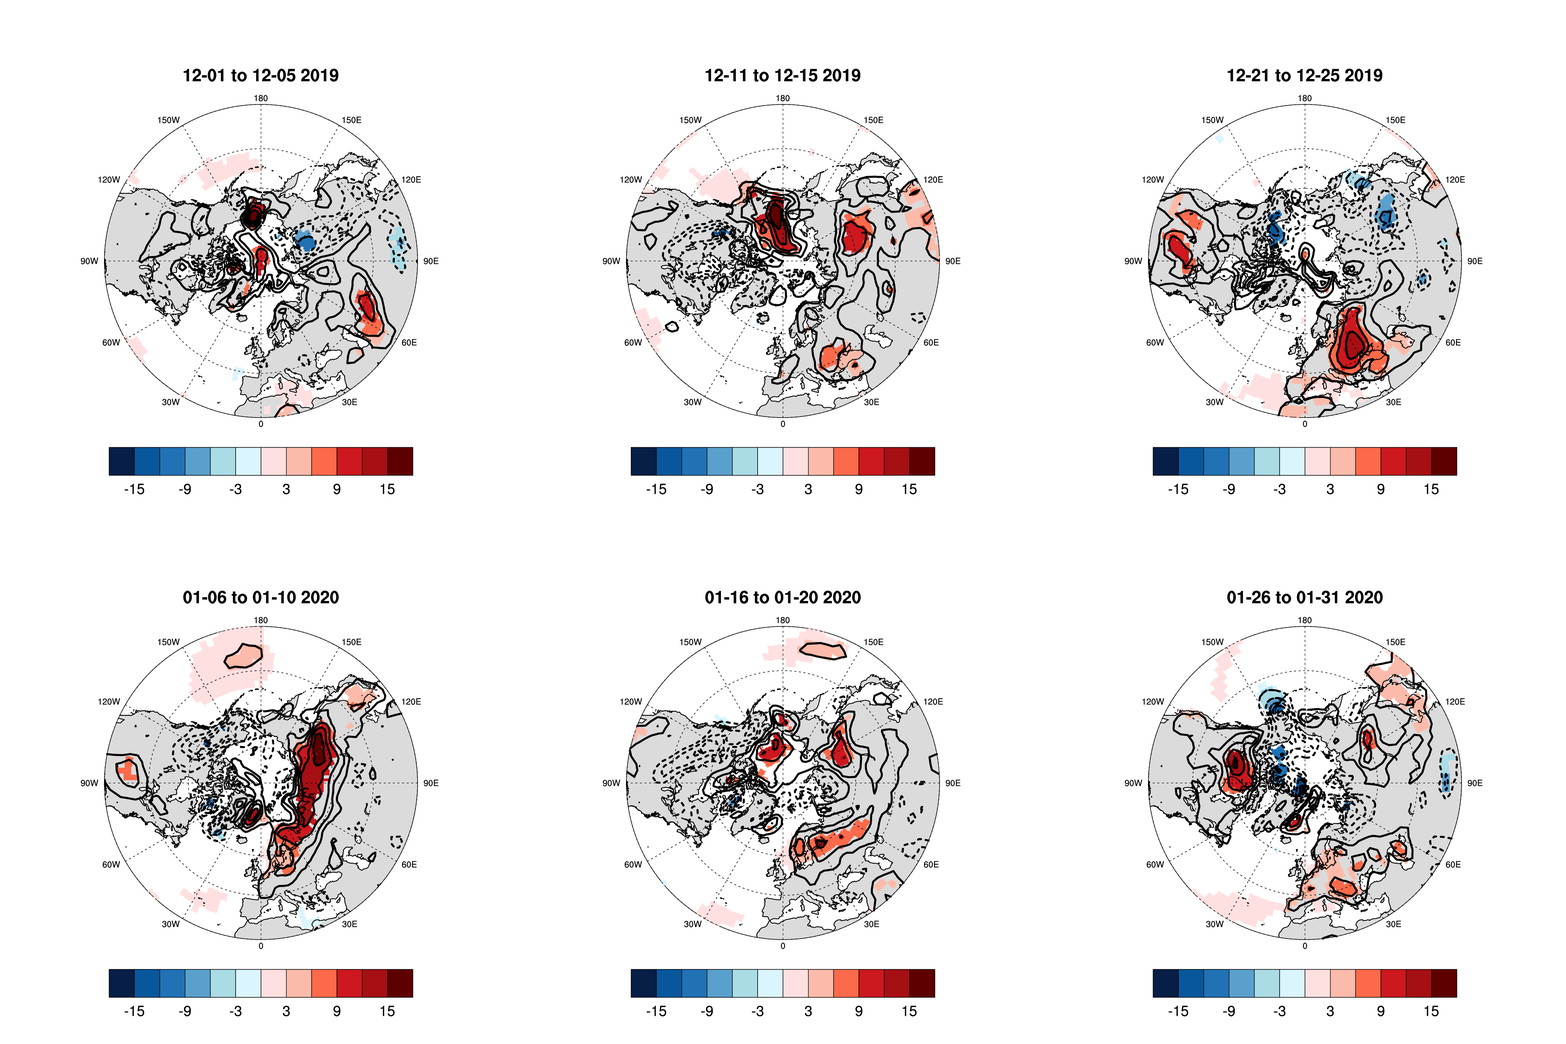
Cold days anomalies (i.e. mean daily temperature below the 10th percentile, shading, K) and 2-meter temperature anomalies (contours)

Z500 anomalies (m) and blocking events (shading), based on the 2D-definition of Scherrer et al. (2005) (latitudinal reversal of Z500)
SST, THFLX and 10-meter wind
SST (shading, K), turbulent heat flux (contours, W/m2), and 10-m wind (vectors, m/s) anomalies
Arctic sea ice, THFLX, T1000, SLP and WAFz
Cold days (T2M<Q10) and blocking events (Z500)


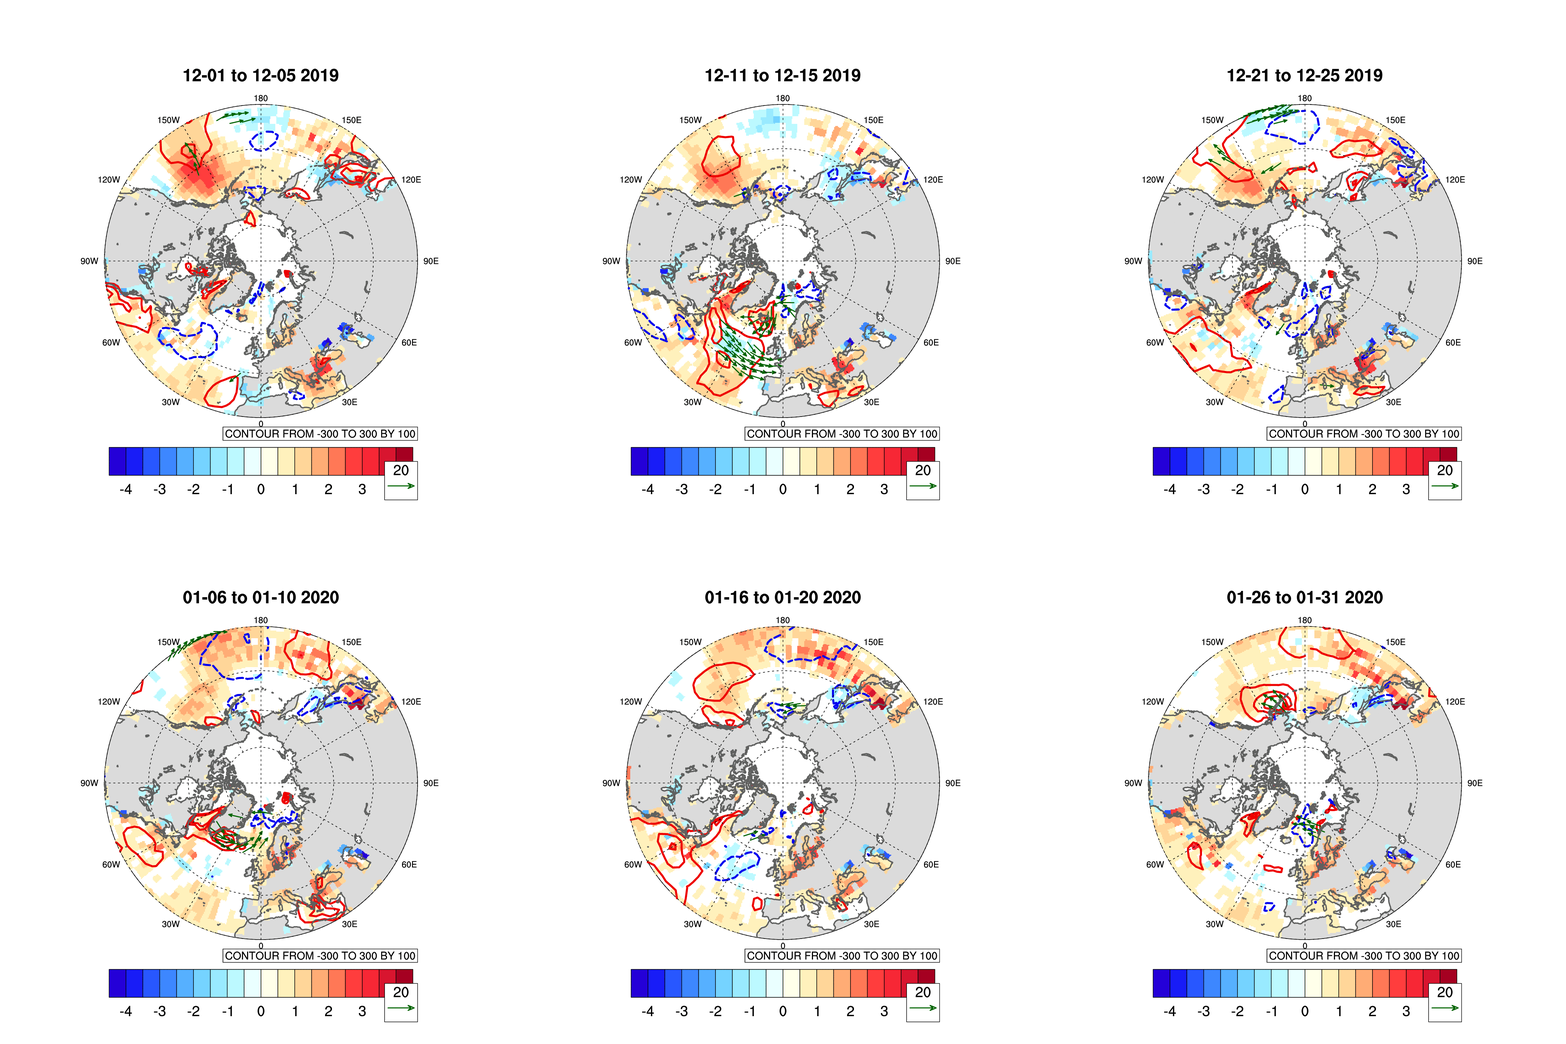
Left : Sea ice concentration (shading, %) and surface temperature (1000 hPa, K) anomalies
Center : SIC (shading, %), turbulent heat flux (contours, W/m2), 10-m wind (vectors, m/s) anomalies
Right : Snow cover (shading, %), sea-level pressure (black contours, hPa) and upward Plumb wave activity flux at 150 hPa (red/blue contours, m2/s2)
Zonal cross sections
U and EPF TEMP and GEOP NAM
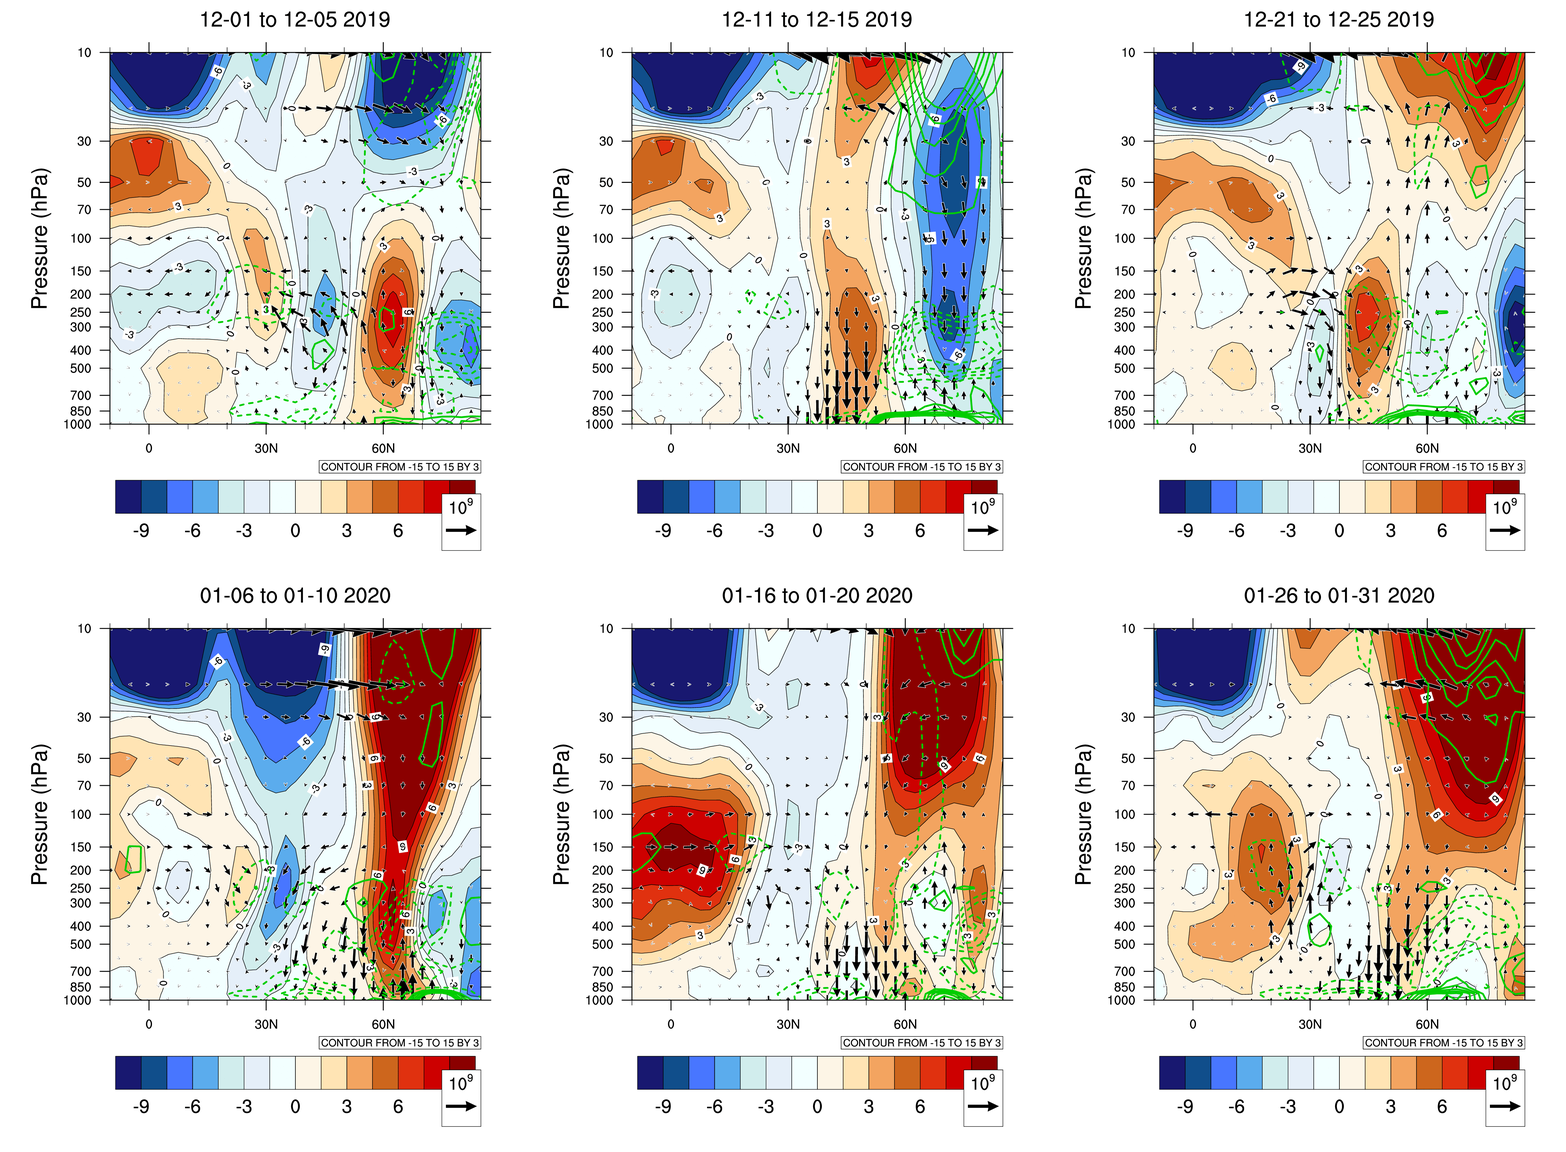
Zonal mean zonal wind (shading, m/s), Eliassen-Palm flux (vectors, m2/s2), and EP flux divergence (green contours, m/s2) anomalies
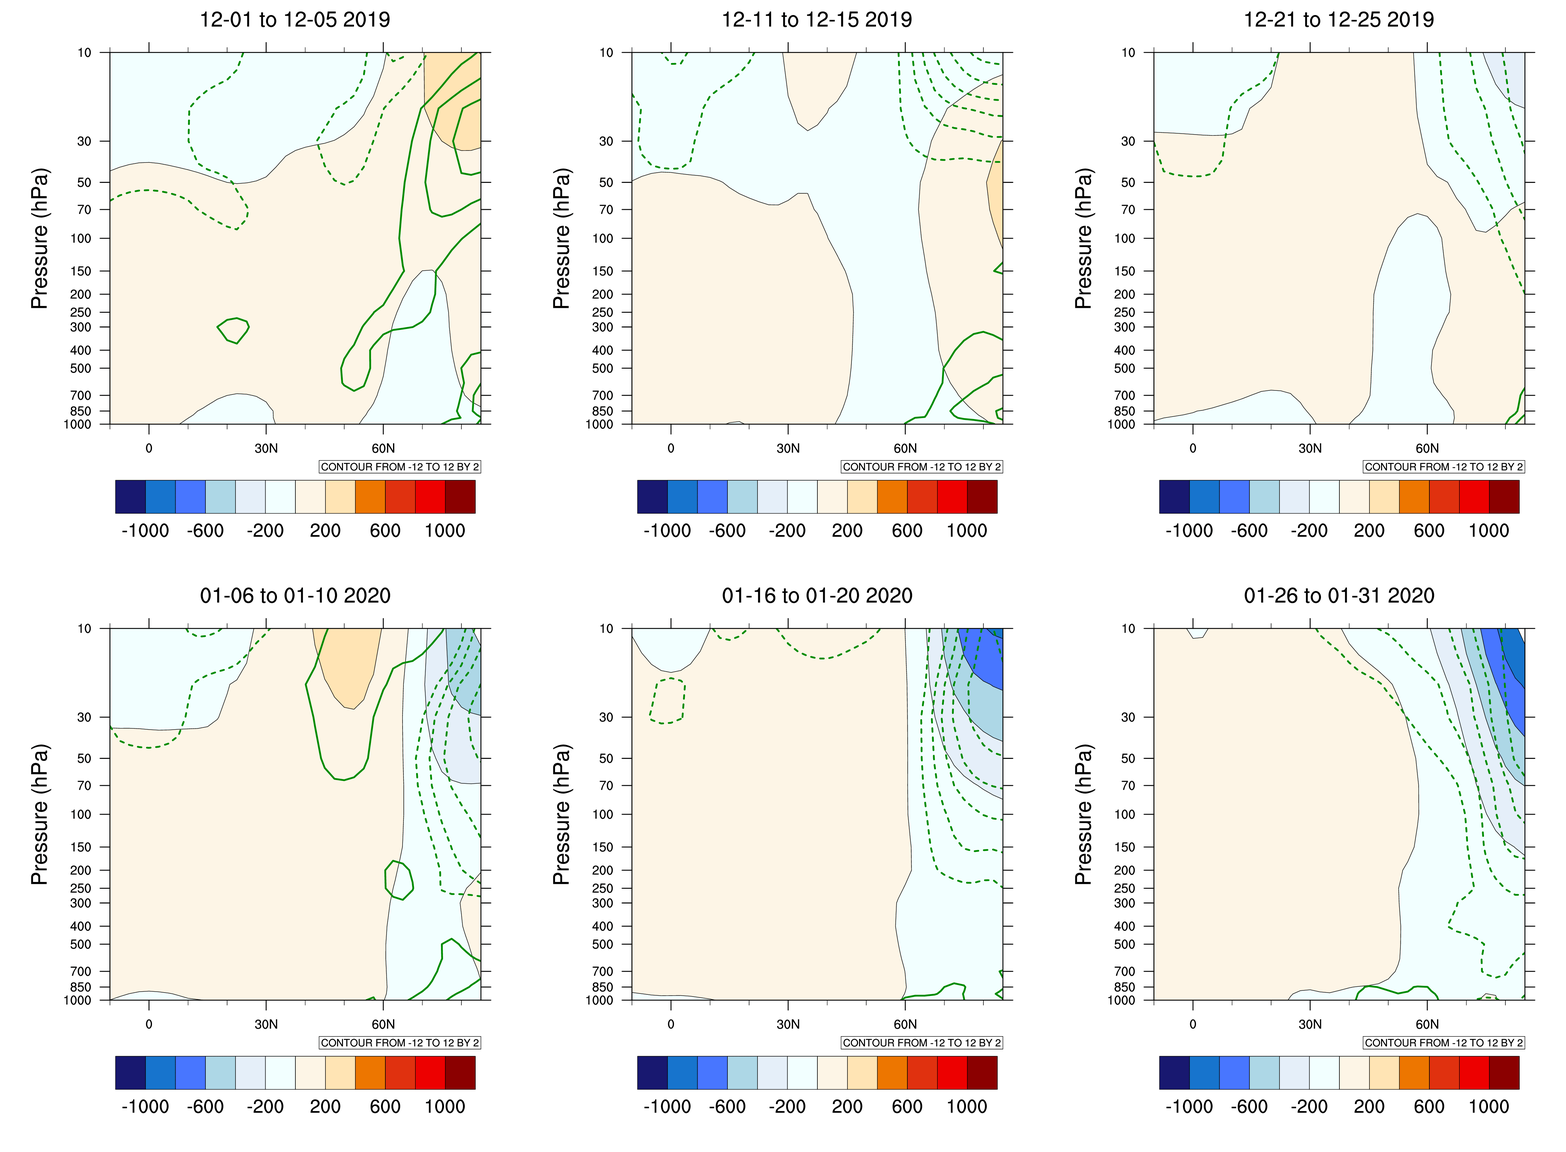
Zonal mean geopotential (shading, m)
and temperature (contours, K) anomalies
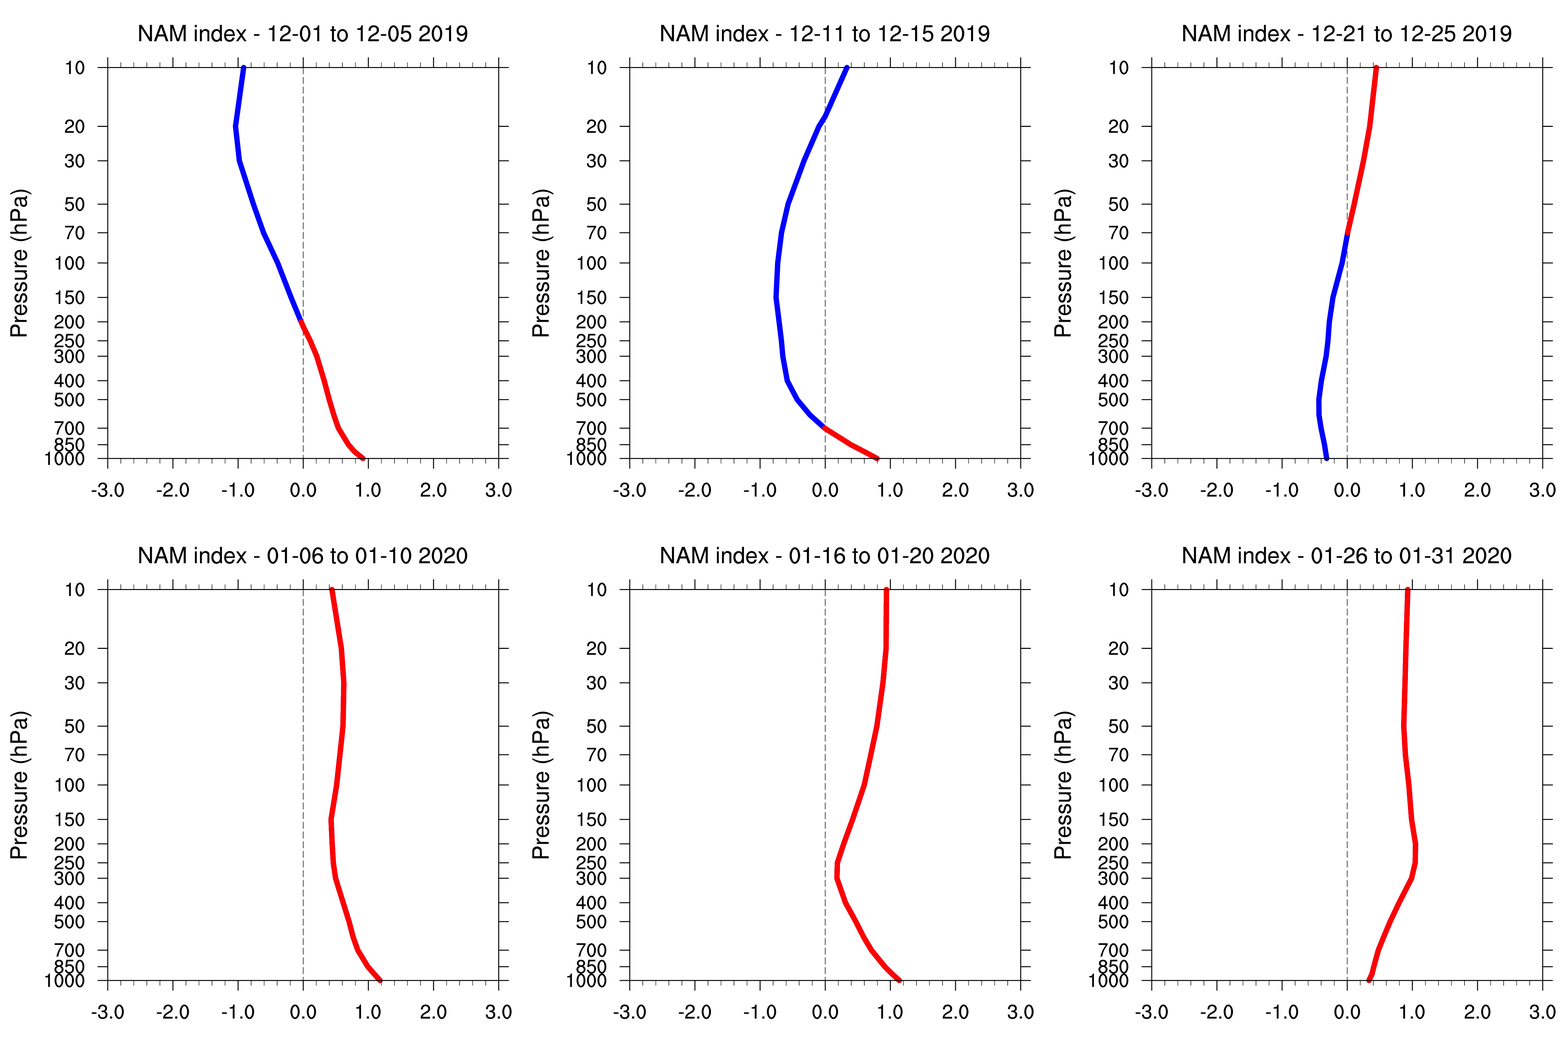
NAM anomalies (standardized polar cap geopotential average)

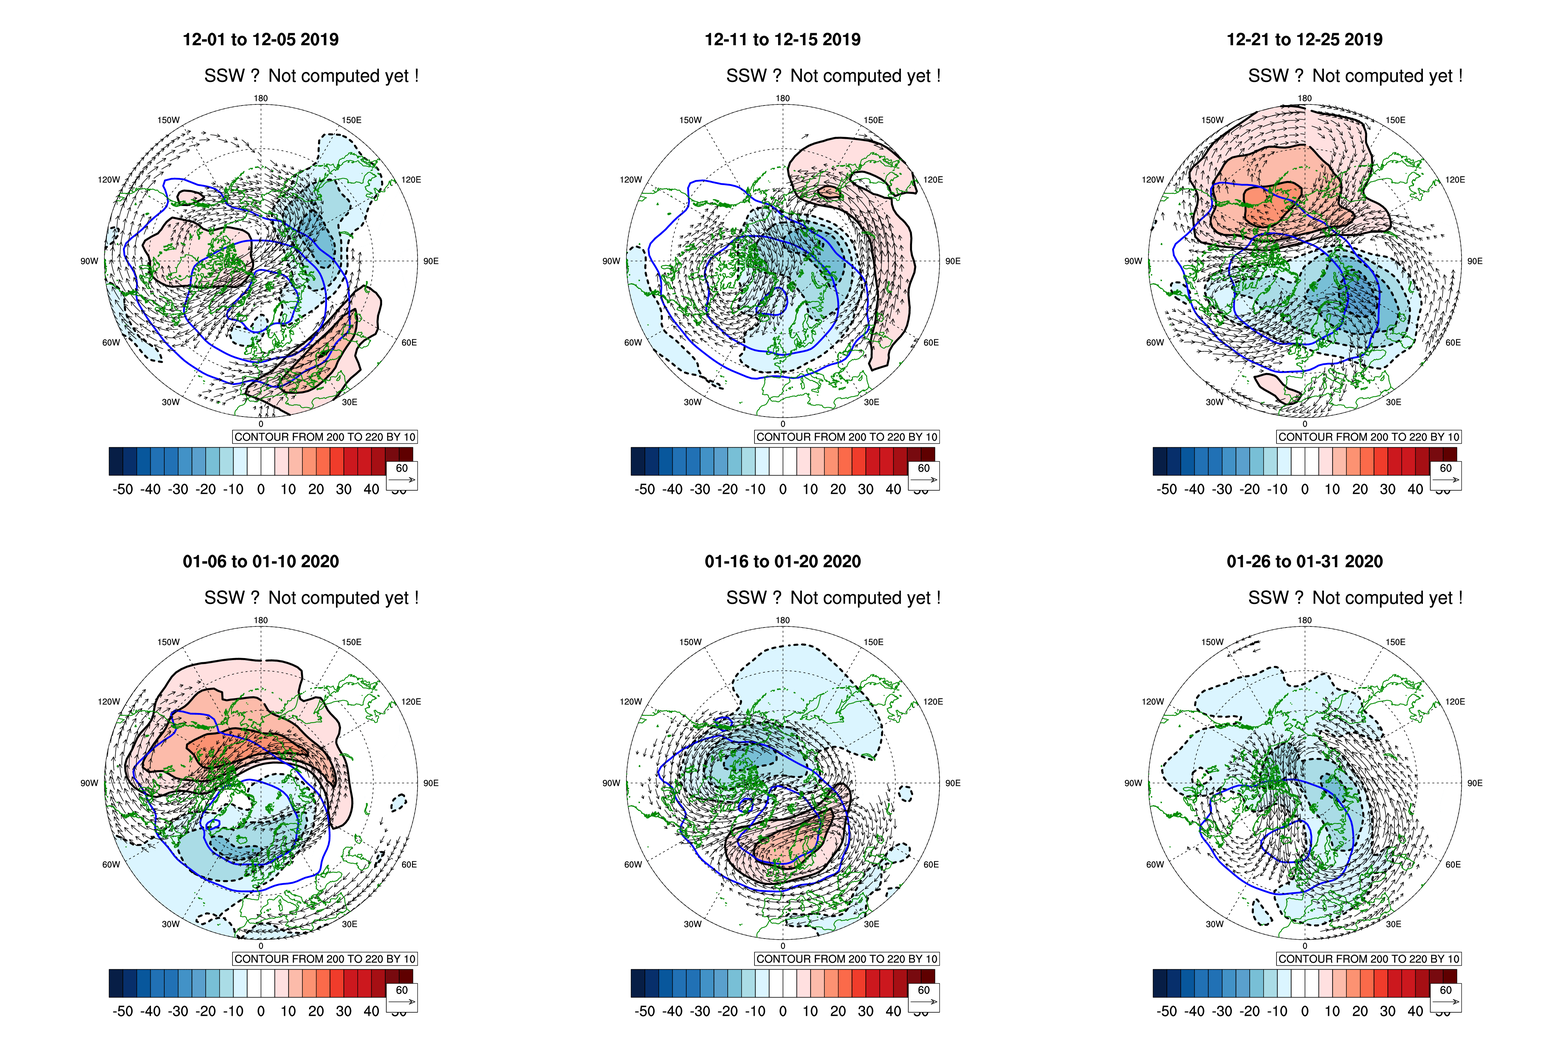
10 hPa temperature anomalies (K) and wind vectors. Blue line shows the climatological vortex position
Stratosphere
Meridional heat flux anomalies at 100 hPa in function of longitude, and zonal average on the right
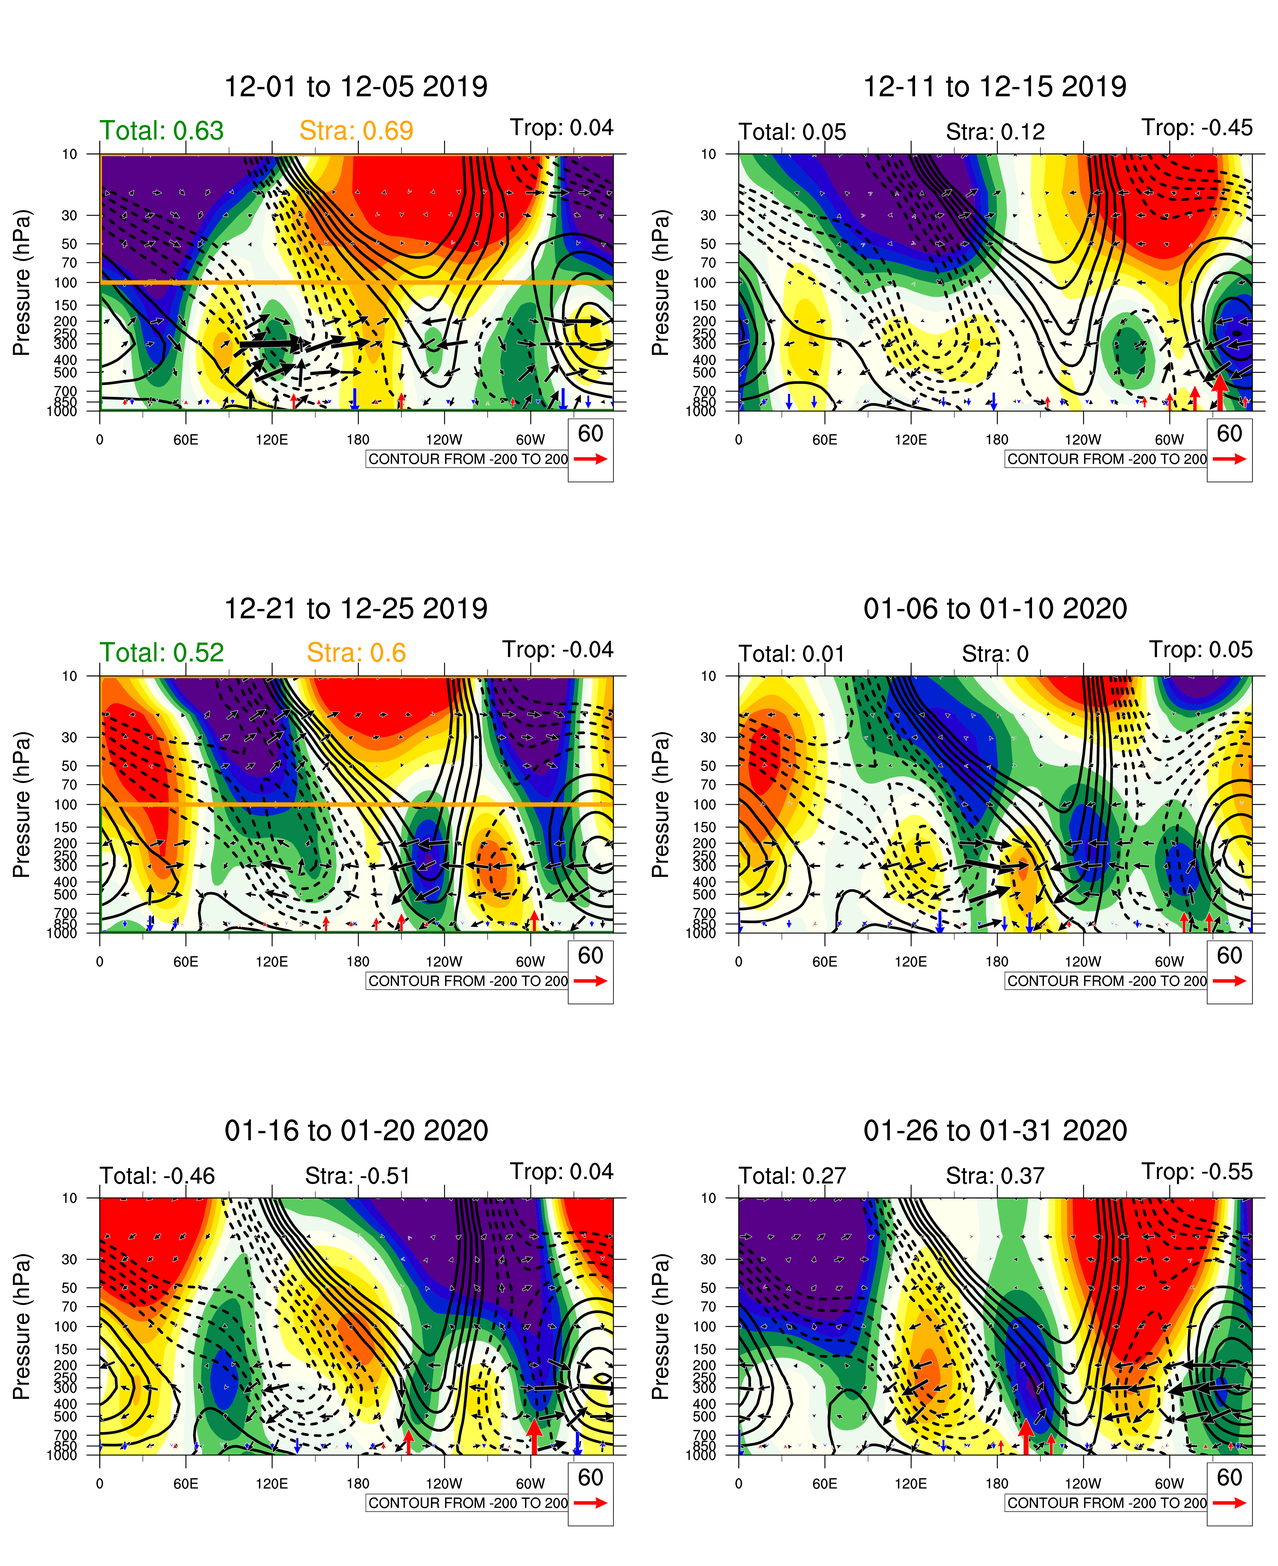
Geopotential eddy at 60N (shading, m) and climatological wave (contours). Black : Plumb wave activity flux. Red/Blue : turbulent heat flux at the surface (40-80N average)


Geopotential wave 1/2 + WAF + THFLX
Same as previous figure but for wavenumber 1
Same as previous figure but for wavenumber 2
Z500 eddies (Anomaly + Climatological)
